Website Heatmap Analysis: How to Find Conversion Blockers
A website heatmap shows in color where visitors click, how far they scroll and where they get stuck. Heatmap types, setting one up with Microsoft Clarity, reading the data correctly, and cookie consent.
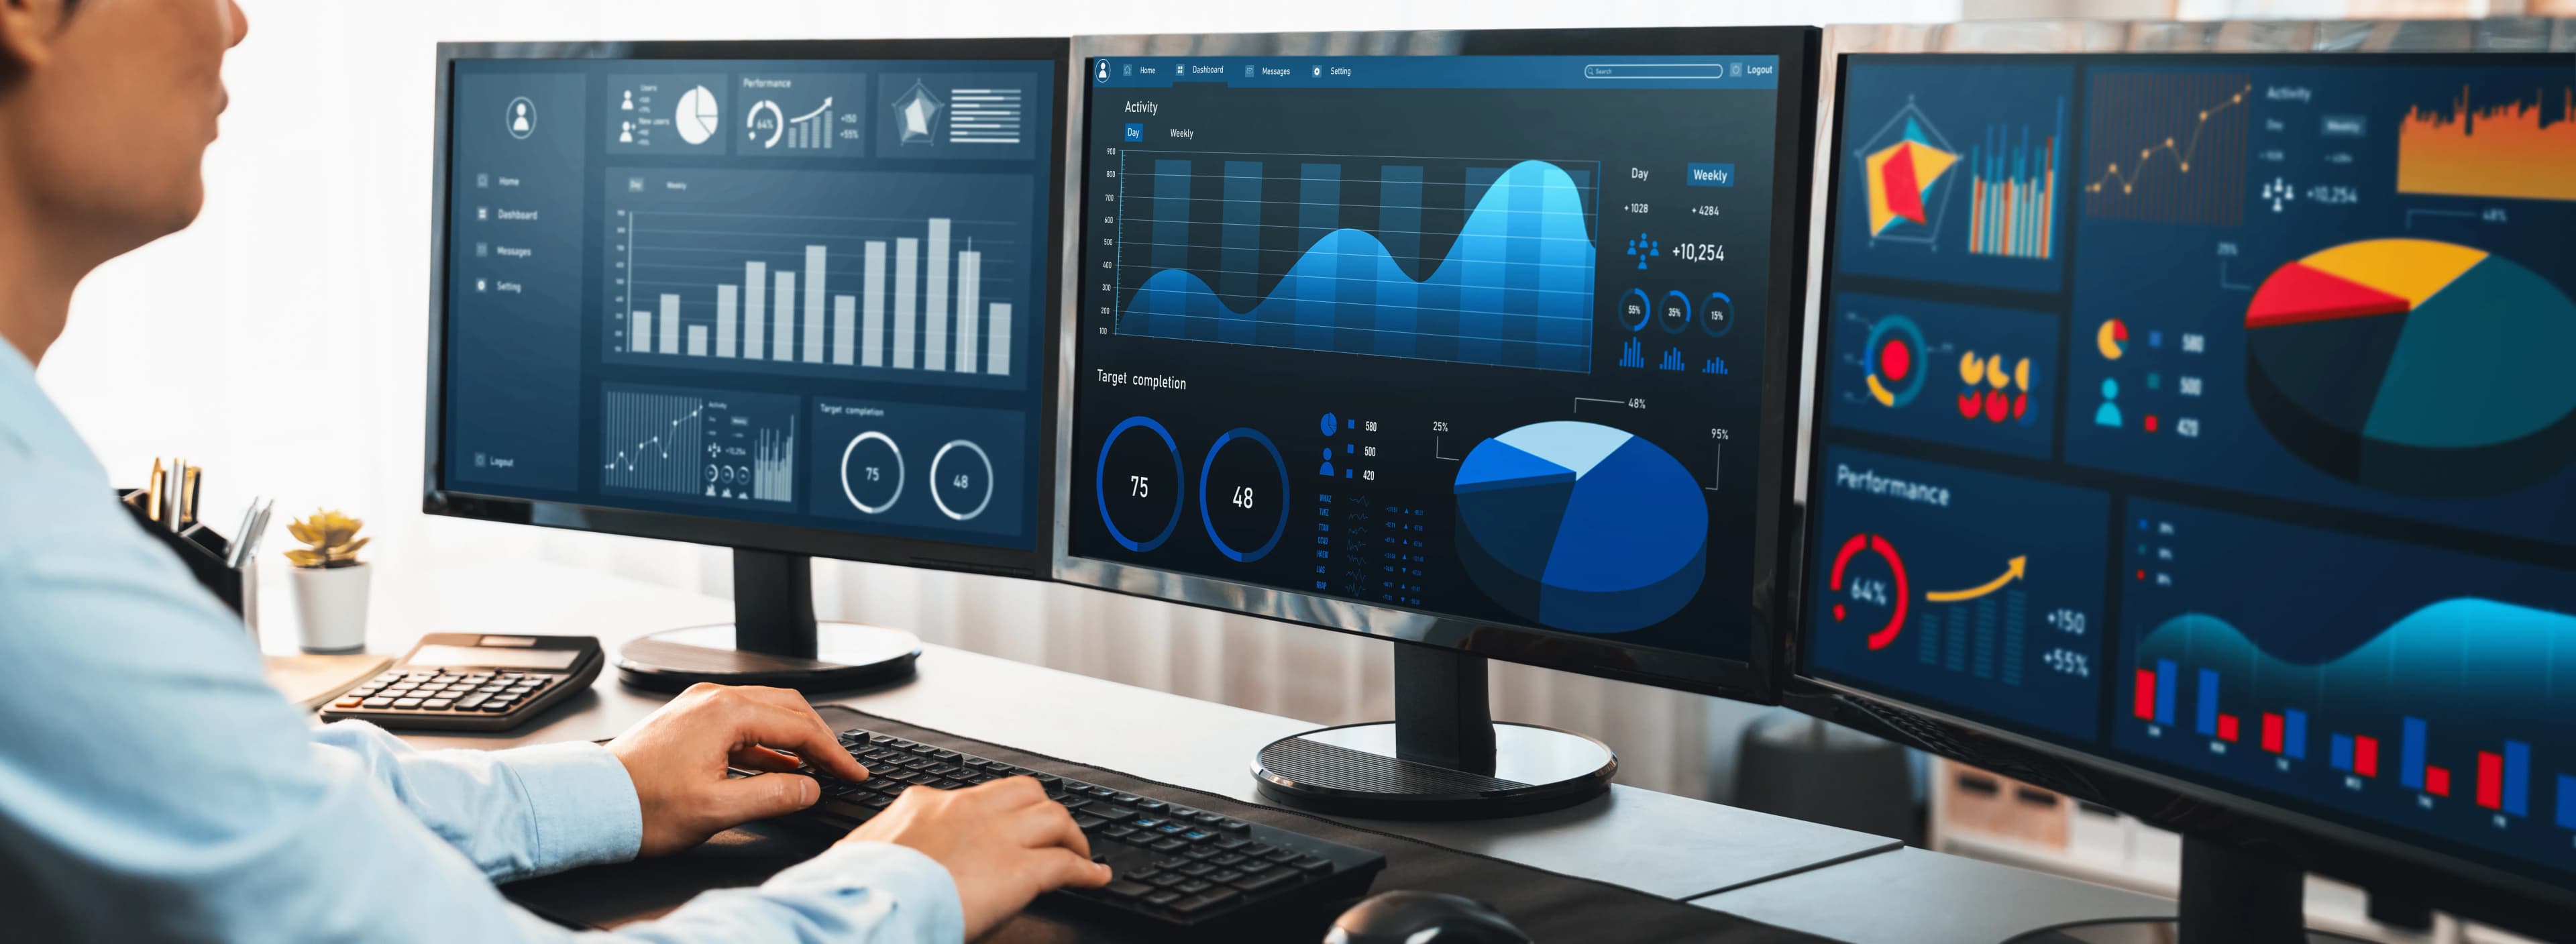
A website heatmap is an analytics view that shows visitor behavior on a page in color: the most clicked areas, how much of the page was seen and which sections hold attention longest are highlighted in warm colors. Analytics reports tell you that a page is not converting; a heatmap shows you where to look for the reason.
The fastest way to start is to add Microsoft Clarity, a free tool, to your site, pick one page with low conversion, and review that page's click and scroll maps separately on mobile and desktop. What you find is not a final answer but a hypothesis to test.
What types of heatmaps are there?
Click map. Shows where visitors click most (or tap, on mobile). The most valuable finding is often clicks on things that are not links: it means users think an image or a heading is a button.
Scroll map. Shows what percentage of visitors reach each point of the page. If your offer or contact form sits at a depth most visitors never reach, the problem is not the copy but the layout.
Area map. Gives the total number of clicks on all elements within an area you select. It is useful for measuring, for example, whether the whole pricing table gets attention or only one package.
Attention map. Shows how much time is spent on each part of the page. A section where people stay long but do not click may be very interesting or may be confusing; you tell the two apart with session recordings.
There are also mouse movement maps, but because the cursor and eye movement do not always match, they should be interpreted carefully on their own.
How do you create a heatmap with Microsoft Clarity?
Clarity is a free heatmap and session recording tool from Microsoft. Setup consists of creating a project and adding the tracking code it gives you to your site. Heatmaps are only generated for pages where the tracking code is installed.
According to Microsoft's documentation, Clarity:
- Offers click, scroll, area, conversion and attention maps.
- Has no waiting period and no minimum traffic requirement for creating a heatmap; the map appears within seconds.
- Lets you create maps for a single page or a group of pages, with PC, tablet and mobile shown separately.
- Counts up to 100,000 page views in a single heatmap.
Clarity's click map also has special filters. Dead clicks show where a click produces no response on the page; rage clicks show where a user clicks the same small area repeatedly in a short time; error clicks show clicks just before a JavaScript error. These three are the fastest starting points for finding conversion blockers.
How do you find conversion blockers with a heatmap?
1. Choose the page. Start with pages that get traffic but where the target action (form, add to cart, search) stays low. Landing pages, product pages and checkout steps are usually the first candidates.
2. Separate devices. The same page produces completely different behavior on mobile and desktop. A button visible on the first screen on desktop can be three scrolls down on mobile.
3. Find the break point in the scroll map. The point where the share of visitors drops sharply is usually where interest fades or where the page gives the impression that it has ended. A large image or a block of white space can make users think the page is over.
4. Look at dead and rage clicks. Clicks concentrated on a non-clickable image, a filter that does not work or a menu that does not open show up here.
5. Confirm with session recordings. Watch a few recordings to see the behavior behind the concentration you saw on the map. The map answers "where", the recording answers "how".
6. Turn the finding into a hypothesis. For example: "Clicks on the product image come from people expecting to zoom in; if we add zoom to the image, add-to-cart will increase." For blockers in the checkout step, the checklist in our article on reducing cart abandonment is a good complement.
What should you watch for when reading heatmap data?
Do not decide before enough data has built up. A map based on a few dozen sessions can make a handful of random behaviors look like a trend. There is no fixed threshold, but if the same finding repeats on different days and across different traffic sources, you can trust it.
Watch out for dynamic content. Drop-down menus, image sliders and personalized blocks can make the screenshot behind the map differ from the page the user actually saw. If you made a major design change to the page, review the old and new periods separately.
Do not use the heatmap on its own. A conversion funnel in an analytics tool such as Google Analytics tells you which page the problem is on; the heatmap tells you where on the page it is; a user survey or feedback tells you why. If all three sources point to the same place, that finding is a priority.
Do you need cookie consent for heatmap tools?
Heatmap and session recording tools use cookies in the visitor's browser and collect behavioral data. For sites serving visitors in Turkey, the Personal Data Protection Authority's (KVKK) Guide on Cookie Practices says that first-party analytics cookies may be treated as "strictly necessary" when they are limited to measuring the site's own audience, produce anonymous statistics and are not used for cross-site tracking. Session recording and behavioral analysis with a third-party tool can fall outside this narrow definition, so for most sites the safe path is to run these tools only after cookie consent. Decide on your own setup together with your legal adviser, and if you serve other markets, check the rules that apply there.
Also check masking so that personal data does not end up in recordings. According to Microsoft's documentation, Clarity runs in "Balanced" masking mode by default; in this mode, numbers and email addresses are treated as sensitive content and masked, while form field contents and drop-down menus are masked in all modes. For sections that display personal information, such as account pages and order summaries, choose strict mode or element-level masking.
In short: heatmap analysis checklist
- Have you chosen a page with low conversion and enough traffic?
- Have mobile and desktop been reviewed separately?
- Have the scroll break point and dead and rage clicks been noted?
- Have the findings been confirmed with session recordings and the analytics funnel?
- Has every finding been turned into a testable hypothesis?
- Have cookie consent and masking settings been checked?
Instead of applying changes directly, validating them with an A/B test is how you separate what actually works. To rebuild your landing page around these findings, see our article on the anatomy of a high-converting landing page, and if you want analysis and testing run together, take a look at our conversion optimization service.
Related service
web development agencySee how we work →How did this land for you?
Be the first to react
Found it useful? Share it:
Frequently asked questions
What is the difference between a heatmap and a session recording?
A heatmap combines the behavior of many visitors into a single view and shows the trend. A session recording lets you watch one visitor's journey on the page like a video. With the first you find the problem area, and with the second you understand what happens there.
Does Microsoft Clarity slow down my site?
Every additional tracking script adds some load to the page. To see the effect, compare your page speed measurements (especially Core Web Vitals) with the period before you added the code, and load it only on the pages you need or after cookie consent.
Can a heatmap replace Google Analytics?
No, it complements it. Analytics gives you traffic sources, conversion rates and funnel drop-off in numbers, while a heatmap visualizes behavior within a single page. The most efficient order is to find the problem page with Analytics first and then look inside that page with a heatmap.
How many visitors do I need before looking at a heatmap?
Clarity has no minimum traffic requirement for a map, but a few dozen sessions are not enough for a meaningful reading. Depending on the page's traffic, look at data covering at least several days, ideally including weekdays and weekends, and check whether the finding repeats in different periods.
Sources
- Heatmaps overview — Microsoft Learn
- Click maps — Microsoft Learn
- Masking content — Microsoft Learn
- Microsoft Clarity - Free Heatmaps & Session Recordings — Microsoft
- Çerez Uygulamaları Hakkında Rehber — Kişisel Verileri Koruma Kurumu
Related articles
- Digital Marketing
How to Find Keyword Search Volume: Free vs Paid Tools
Search volume is an estimate of how often a keyword is searched each month. Here is how to get it free from Keyword Planner, read Google Trends correctly, use Search Console data and decide when paid tools help.
6 min read - Digital Marketing
Anatomy of a High-Converting Landing Page: Structure and Design
A high-converting landing page delivers the ad's promise on the first screen, focuses on a single action and removes what stands in its way. Here is the structure, the first-screen essentials, forms, speed and testing.
6 min read - Digital Marketing
Google AI Overviews: Content and Structure Strategy
Learn how to structure pages so they can be cited in Google AI Overviews: direct answers, clear headings, trust signals and checks.
5 min read